Introduction
One of ClickUp's most powerful features is its Gantt chart integration. They provide a visual representation of a timeline and task dependencies, making it easier to manage and track the progress of a project. Gantt views are particularly effective in showcasing this information.
In this article, we'll look at how to use ClickUp's Gantt chart view to manage your projects.
Getting Started with ClickUp Gantt View
What is a Gantt Chart?
A Gantt chart is a popular project scheduling tool that displays tasks on a calendar-like grid with date intervals. It allows you to map out project schedules and task dependencies visually.
Gantt charts help you plan realistic timelines, identify resource conflicts, and track project progress in one view.
To build a Gantt chart, you must first identify the different tasks to be done. These must be broken down into distinct steps to obtain an overall view of the project.
Key Elements of a Gantt Chart:
- Task names: Listed on the y-axis
- Task duration: Displayed as bar lengths
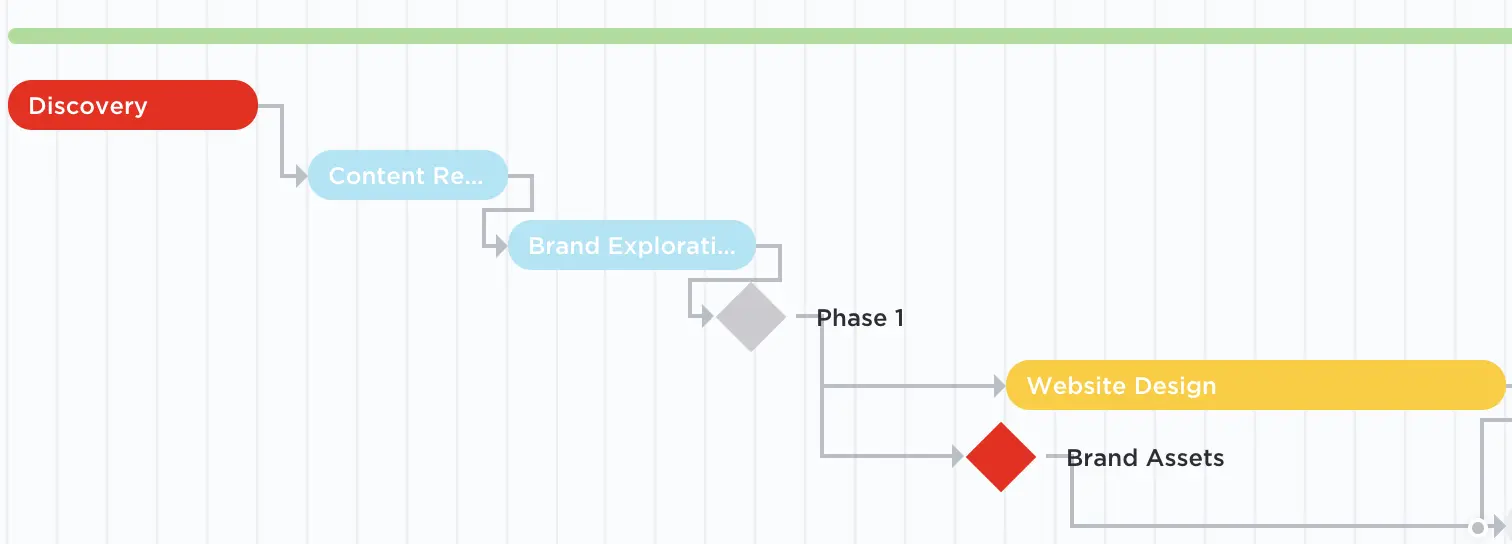
- Task dependencies: Shown as links between bars
- Milestones: Displayed as diamonds
- Resource allocation: Represented by bar heights
How Do You Read a Gantt Chart?
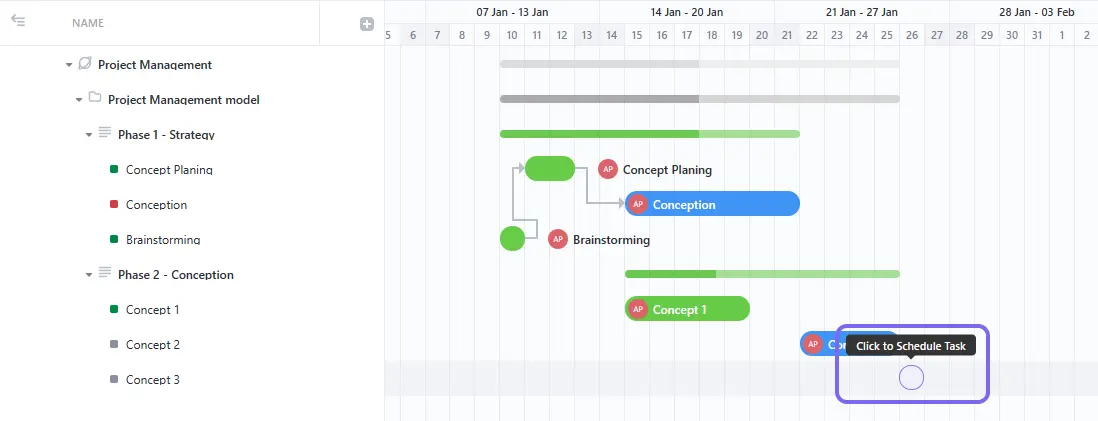
Reading a Gantt chart in ClickUp is straightforward. The Gantt view provides a visual timeline of your project, making it easy to understand and manage.
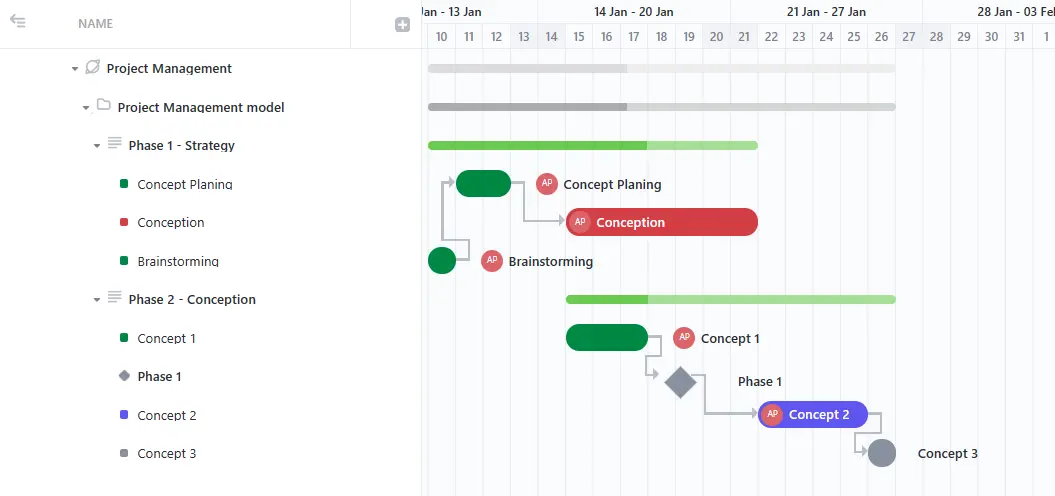
Task Details (Y-axis)
On the left side, you'll see a list of all your project tasks and subtasks organized by hierarchy levels (Spaces, Folders, Lists).
- Expand or collapse each level to see more or fewer details.
- Add new tasks, and subtasks or reorganize using drag-and-drop.
- View additional columns like Assignees, Due Dates, Status, etc.
Task Progress (X-axis)
The main area displays your project timeline with color-coded taskbars:
- Each bar represents a task - its length shows the duration.
- The bar position shows the scheduled start and end dates.
- Lines connecting bars indicate task dependencies.
- The top progress bar shows the overall project completion percentage.
The Gantt view gives you a clear, visual overview of your project's tasks, deadlines, and dependencies. This powerful view helps you effectively plan, manage resources, and meet project timelines.
Gantt View Capabilities
ClickUp's Gantt view offers many features for planning and tracking the progress of your projects visually. Here are some of the actions you can perform with this view:
The Gantt View is the Best to:
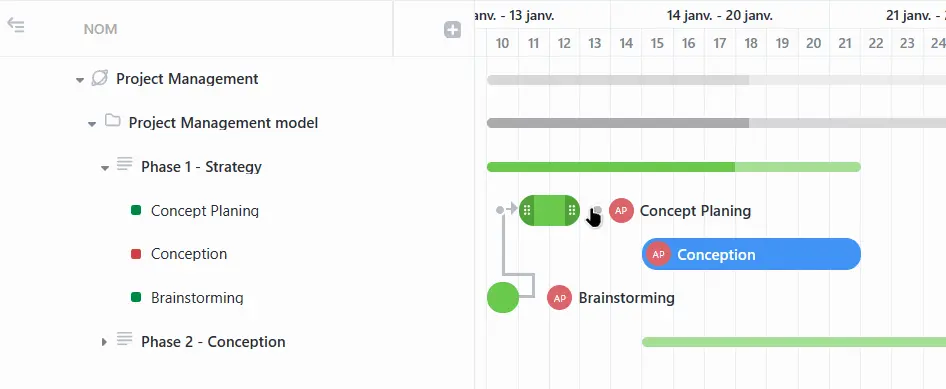
- Set Task Relationships: Click-and-drag tasks in the Gantt view to create dependencies between tasks. When you move a parent task that has dependencies, all subsequent tasks that depend on it are automatically updated and rescheduled.
- Visually Define Your Task Start and End Dates: Simply drag and drop tasks in the Gantt chart to easily adjust their start dates and due dates.
- Set Dependencies Between your Tasks: If a task depends on another one being completed first, you can simply specify that relationship by linking the tasks with dependency arrows in the Gantt view.
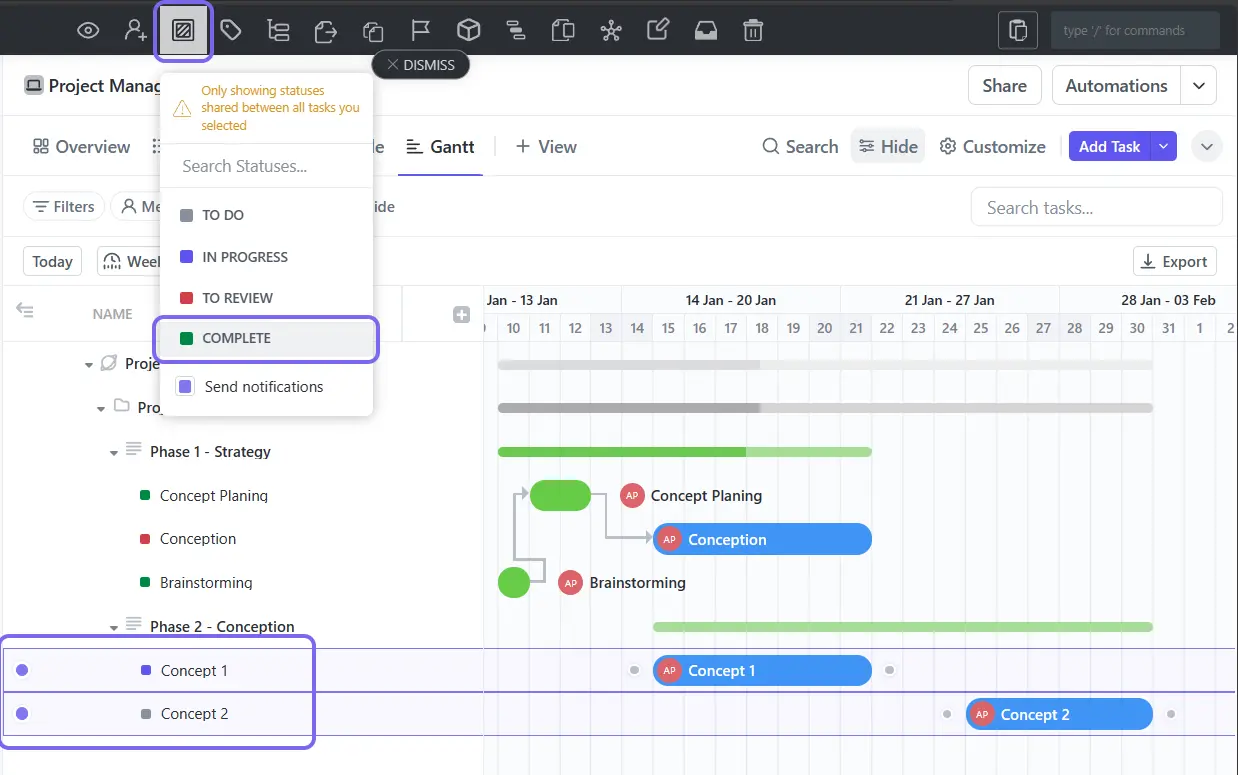
- Edit your Tasks in Batch with Multiple Task Selection: Select many tasks in the Gantt chart and perform mass actions like assigning members, changing dates, and updating status using the bulk editing toolbar.
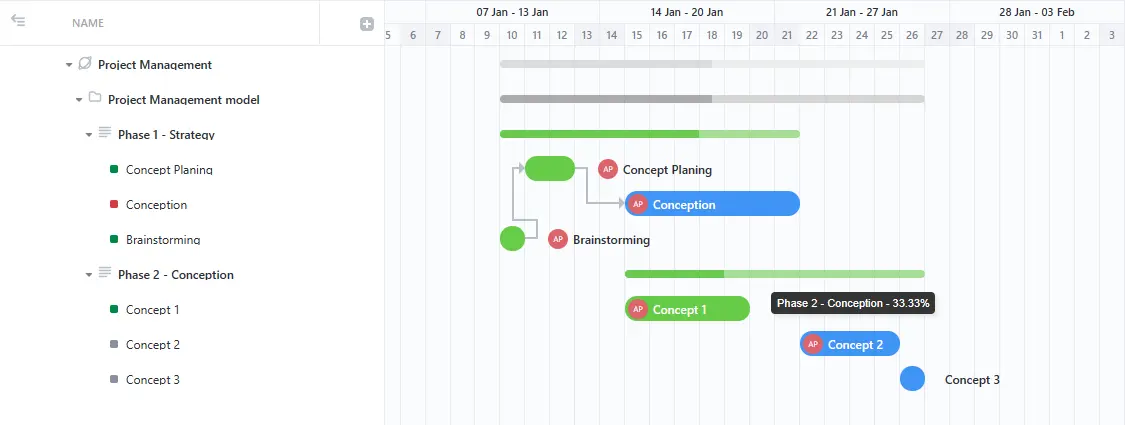
- See the Progress of Your Tasks in your Location (Folder or List): The Gantt view lets you to quickly know how much work is left to complete a folder or list by hovering over the progress bar to view the percentage completed.
The Gantt view provides you with powerful, customizable tools to plan projects strategically inside ClickUp.
Creating a Gantt View in ClickUp
To create Gantt charts in ClickUp, follow these steps:
- Go to the List, Folder, or Space where you manage projects
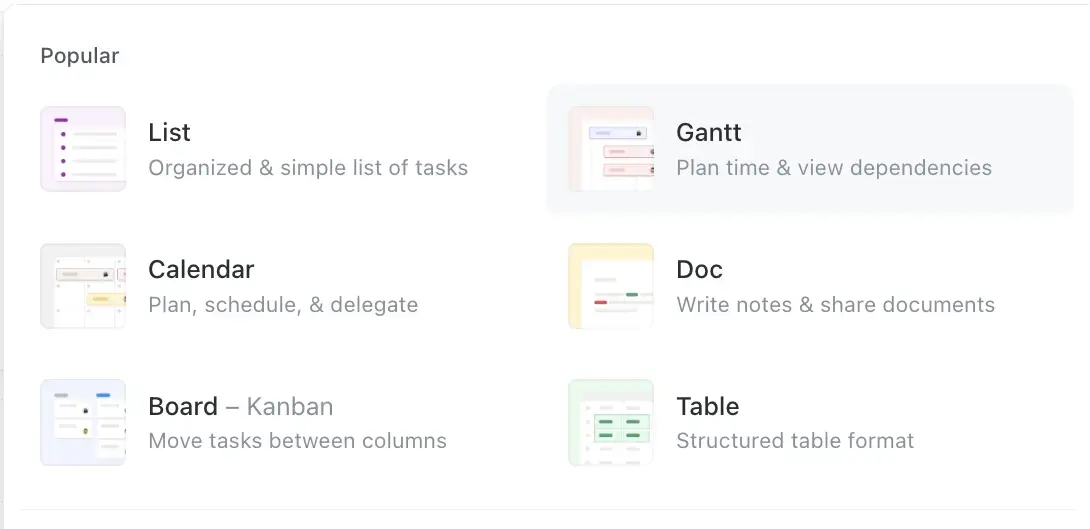
- Select “Gantt” from the views menu
- Your Gantt chart will be created, just rename it if you need to!
Managing Tasks and Milestones
ClickUp's Gantt view provides a comprehensive command center for managing your tasks, subtasks, and milestones throughout the project timeline.
Creating and Scheduling Tasks
Instead of building tasks elsewhere, you can quickly add new folders, lists, tasks, and subtasks directly in the Gantt view itself. It's as easy as:
- Hovering over any area and clicking the + icon
- Dragging and dropping to schedule start and due dates
Setting Task Dependencies
A core benefit of Gantt charts is visualizing task dependencies. In ClickUp, you can link dependent tasks by simply clicking and drawing a line between them. This automatically sets up the relationship, making sure tasks can't start until the tasks they depend on are completed.
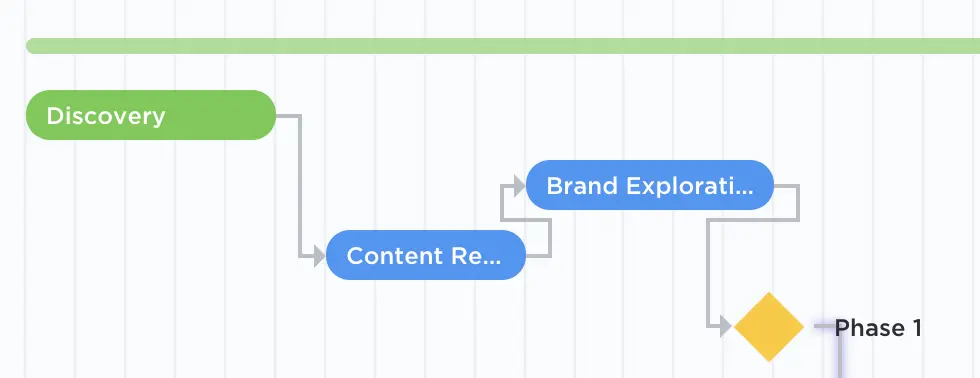
Milestone Management and Tracking
Milestones are crucial in measuring progress. ClickUp's Gantt view allows you to set milestones, visually distinguishing them from regular tasks. This feature is great for tracking critical dates and deliverables, providing a clear overview of project progress.
Implementing Milestones:
- Identify key phases.
- Set milestones at critical junctures.
- Use color coding for easy identification.
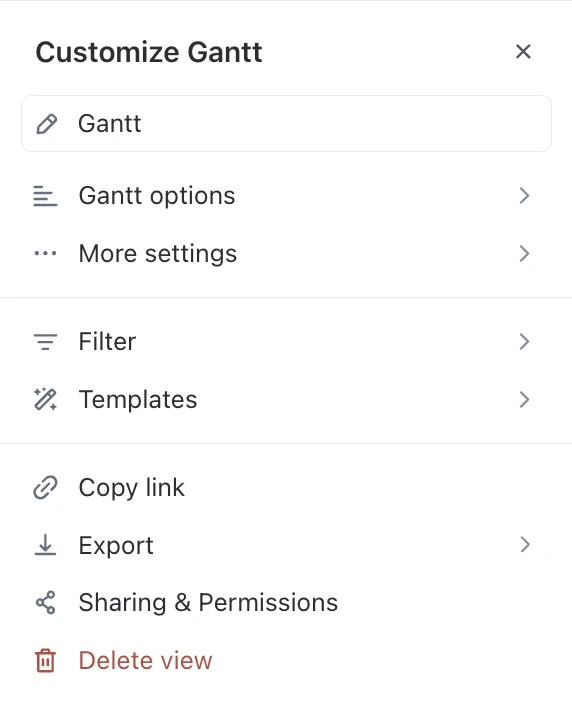
How to Customize Gantt View in ClickUp?
Coloring Tasks
One of the first ways to customize the Gantt chart view is by assigning colors to your tasks based on different criteria. ClickUp offers several color schemes to choose from, including:
Default Color Scheme
- Active tasks are blue
- Completed tasks are green
- Milestones are yellow
Priority-based Color Scheme
- Urgent tasks are red
- High-priority tasks are yellow
- Normal priority tasks are blue
- Low-priority tasks are gray
- Tasks with no priority assigned are white
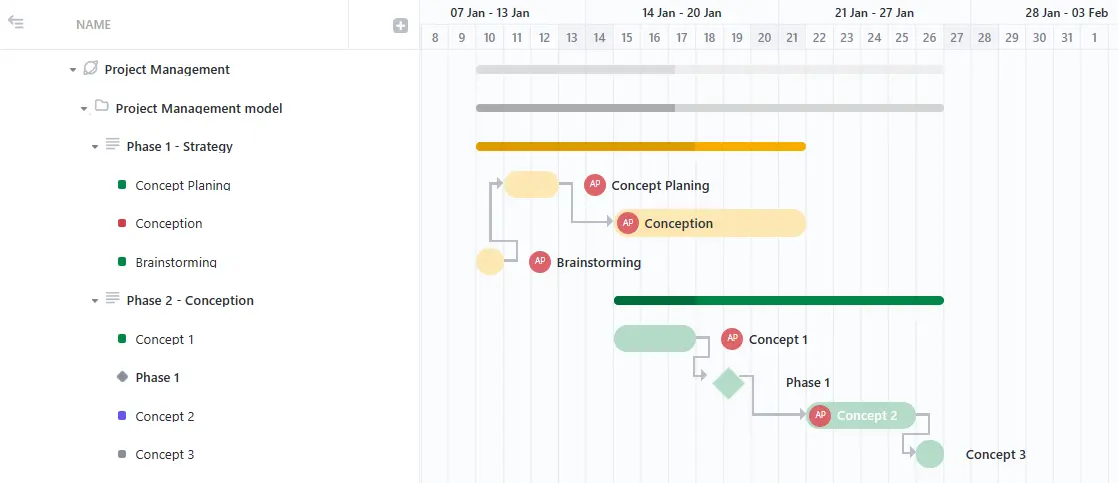
Status-based Color Scheme
Tasks are colored based on their current status, making it easy to identify their progress at a glance.
List-based Color Scheme
Tasks inherit the color of their respective lists, providing a visual representation of how tasks are organized across different projects or teams.
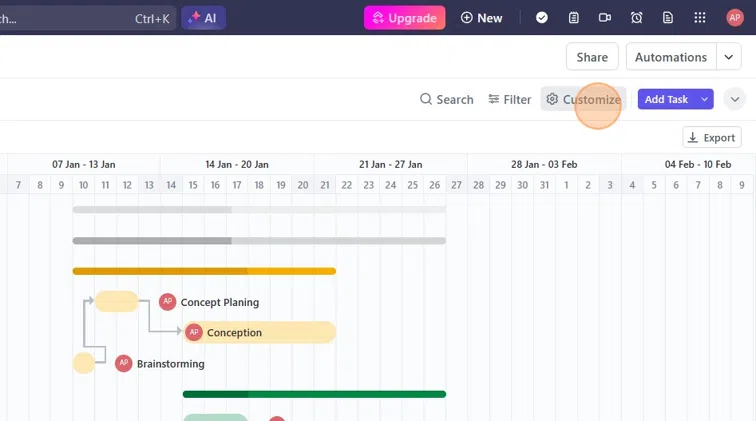
To change the color scheme, simply click on the “Show” button in the top right corner of the Gantt chart view and select the desired “Color Scheme” option.
Choosing the Time Scale
The Gantt chart view allows you to adjust the time scale to suit your project's needs. You can view your tasks and dependencies by hour, day, week, month, or year, giving you the flexibility to zoom in or out as required.
To change the time scale, click on the “Week/Day” button in the top right corner and select the desired option from the “Timescales” menu.
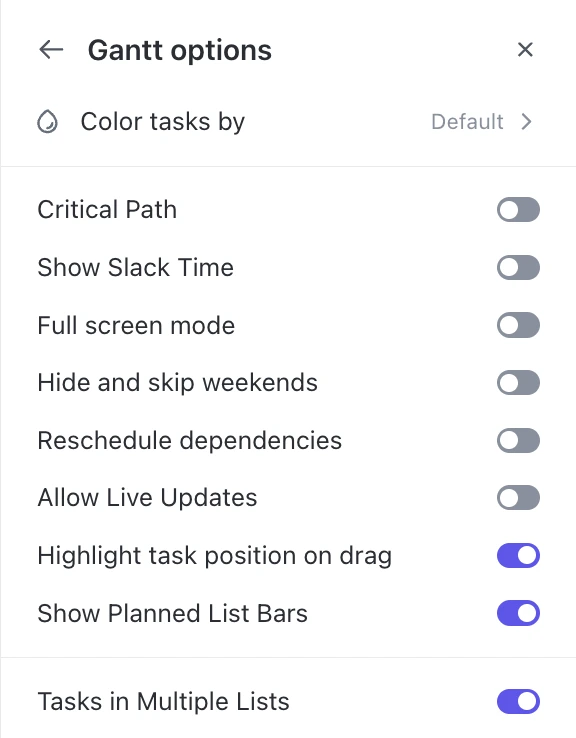
Hiding Weekends
If you prefer not to schedule any tasks or dependencies on weekends, ClickUp offers the option to hide and skip weekends entirely. This feature makes sure that tasks are automatically rescheduled to the nearest weekday, preventing any accidental assignments on Saturdays or Sundays.
To enable this feature, click on the “Show” button and toggle the “Hide and skip weekends” option.
Sort Tasks
Organizing your tasks in a meaningful order can greatly improve your ability to manage your projects effectively. ClickUp allows you to sort tasks in the Gantt chart view based on various criteria, including:
- Assignees
- Date created
- Due date
- Task ID
- Order index
- Task name
- Priority
- Start date
- Status
- Time estimates
- Time tracked
To sort tasks, hover over the column header in the left sidebar of the Gantt chart view and click on the desired sorting option.
Advanced Features of ClickUp Gantt Views
Let's look at how to balance workloads better and quickly reschedule tasks with these advanced features in ClickUp's Gantt View.
Balance Workloads With Slack Time
One powerful feature in ClickUp's Gantt view is the ability to view and manage “slack time” for your tasks. Slack time refers to the flexibility or extra time available to complete a task before it impacts the overall project deadline.
By turning on the “Show Slack Time” option, you'll be able to instantly identify tasks that have breathing room in their schedules versus those on the critical path that require close monitoring.
Rescheduling your tasks easily
If you need to reschedule a task or an entire project, ClickUp makes it simple with drag-and-drop rescheduling:
- Just grab any parent task and move it
- All subtasks and dependencies will shift accordingly
Displaying Custom Fields
ClickUp supports the addition of custom fields to your tasks, allowing you to capture and display project-specific information. In the Gantt chart view, you can choose to display these custom fields as columns, providing you with a comprehensive overview of your task details.
To add custom field columns, click on the “plus” icon in the left sidebar and select the desired fields from the “Show Columns” menu.
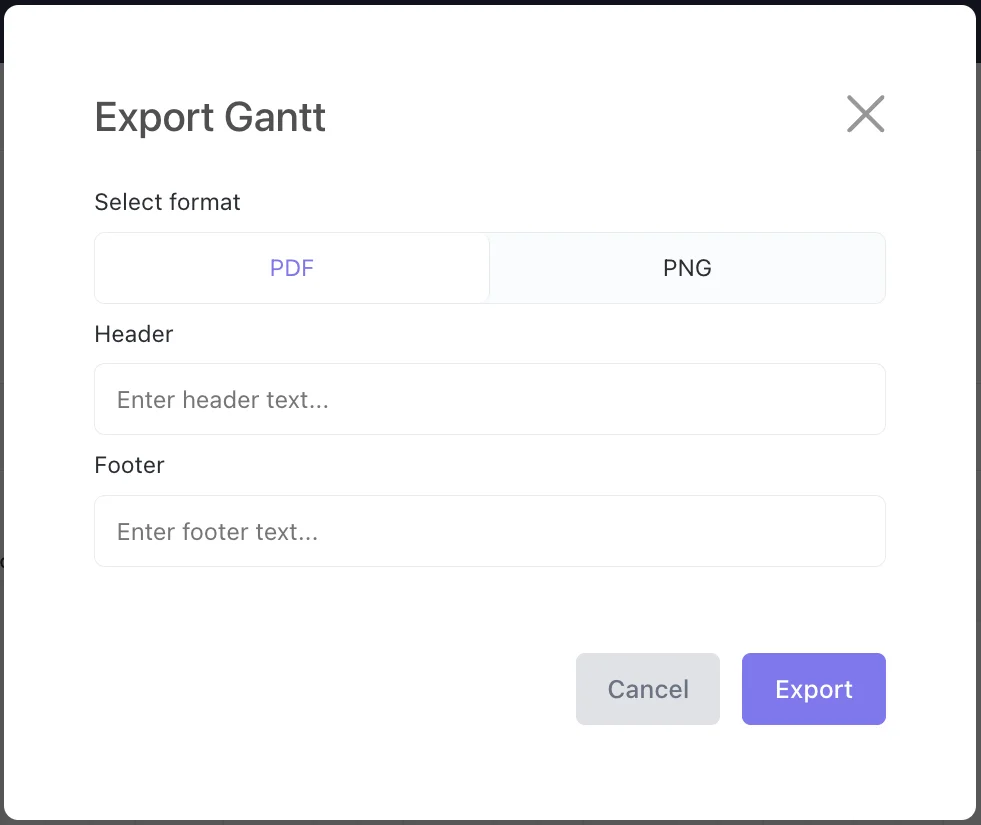
Exporting the Gantt chart
When you need to share your Gantt chart externally, ClickUp offers convenient exporting options. Users on the Business Plan and higher can export the full Gantt chart as a:
- PDF file
- PNG image
This allows you to easily share a snapshot of your entire project's timeline, tasks and dependencies, milestones, and more with clients, stakeholders or remote team members.
You can even customize the export by adding:
- A header or footer with project details
- The project name automatically pulled in
- The current date and time for reference
Why ClickUp is Better Than an Excel Gantt Chart
When you plan projects, ClickUp's Gantt view is way easier to use than Excel's Gantt charts. Let's see why.
Excel's Limitations
- No automation: Manually updating tasks, due dates, and dependencies is tedious for complex projects.
- Can't calculate critical path: Identifying the sequence of crucial tasks is difficult.
- Lacks insights: Basic visuals provide no analytics for informed decisions.
- Not user-friendly: Cluttered layout buries task details, overwhelming for large projects.
ClickUp's Advantages Over Excel
- Automated processes: When dragging a task with dependencies, subsequent tasks are automatically rescheduled for efficient project management.
- Critical path calculations: Easily identify and manage critical tasks to meet deadlines.
- Detailed insights: Hovering over the progress bar shows what's required to complete based on tasks completed vs total tasks.
- Organized and customizable: A clean interface lets you view dependencies, customize color schemes, add columns like assignees, and drag-and-drop to adjust schedules. Use filters, hide weekends, and create milestones.
With ClickUp's Gantt, you can plan, schedule, and execute projects efficiently, simplifying the entire workflow. Its automation, insights, and user-friendly design give project managers, solopreneurs, and agencies more time to be creative.
Common Challenges and Solutions
While ClickUp's Gantt view is extremely powerful, some common challenges may arise. Here are a few frequent issues and how to solve them:
Confusing Task Structure
With a complex project hierarchy containing many nested tasks and subtasks, the sidebar can become cluttered and difficult to work with.
Solution: Use the expand/collapse functionality to only show the levels you need to focus on. You can also adjust the sidebar width and reorder items via drag-and-drop.
Missed Dependencies
It's easy to overlook task dependencies, especially when updating schedules frequently.
Solution: Check the “Reschedule Dependencies” option under Settings. This will make sure ClickUp automatically adjusts all subsequent tasks in the chain when you reschedule a task with dependencies.
Weekend Scheduling Conflicts
Having team members scheduled for weekend work can lead to burnout and lower productivity.
Solution: Enable the “Hide and Skip Weekends” setting. ClickUp will intelligently adjust schedules so no project tasks start or end on weekends.
Conclusion
The Gantt chart is a powerful tool that can help you manage your projects more efficiently. Providing a visual representation of your project timeline and task dependencies, allows you to easily identify potential bottlenecks and make adjustments to make sure your project stays on track.
With ClickUp's Gantt view, you can enjoy all the benefits of a traditional Gantt chart, while using the power of a modern project management platform. From defining task dependencies to coloring tasks and customizing your time scales, ClickUp makes it easy to customize your Gantt chart to your specific needs, making sure you stay ahead in project planning and execution.
Whether you're a seasoned project manager or new to the field, integrating ClickUp's Gantt View into your workflow can be a significant improvement in how you plan, track, and deliver your projects.
If you need help with setting it up, you can always schedule a discovery call with us.
Got a project with ClickUp?
Book a call Now 🗓️Supercharge your business today