


Passion Beauté saves about 5 hours a week with automated dashboards
Before & After
Executive Summary
Passion Beauté and Déco d'autrefois are 2 retail and e-commerce businesses run side by side, sharing a ClickUp workspace that had grown cluttered and inconsistent across both.
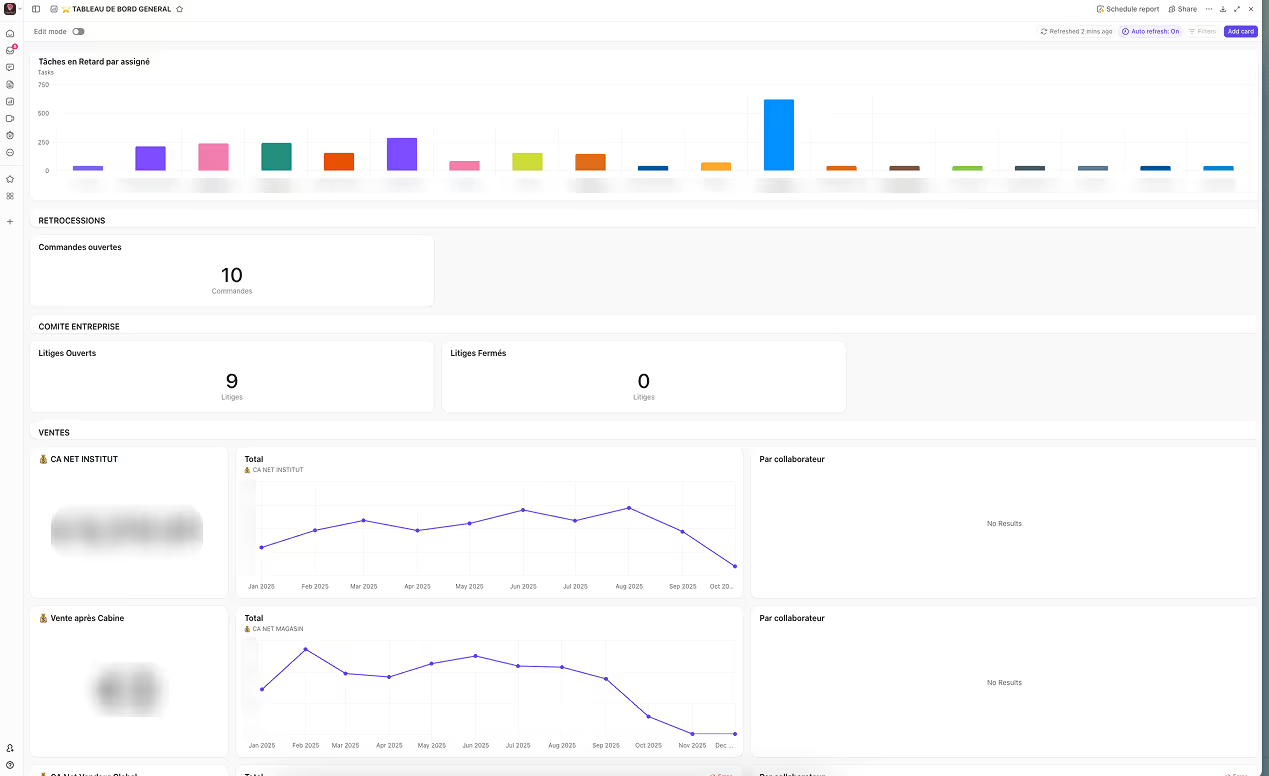
UpSys cleaned the workspace up, automated the recurring work, and built dashboards that carry the numbers on their own. Manual reporting time fell by over 90 percent, which is about 5 hours a week, and leadership reads 3 to 5 key KPIs with red, orange and green alerts instead of assembling them.
The Challenge
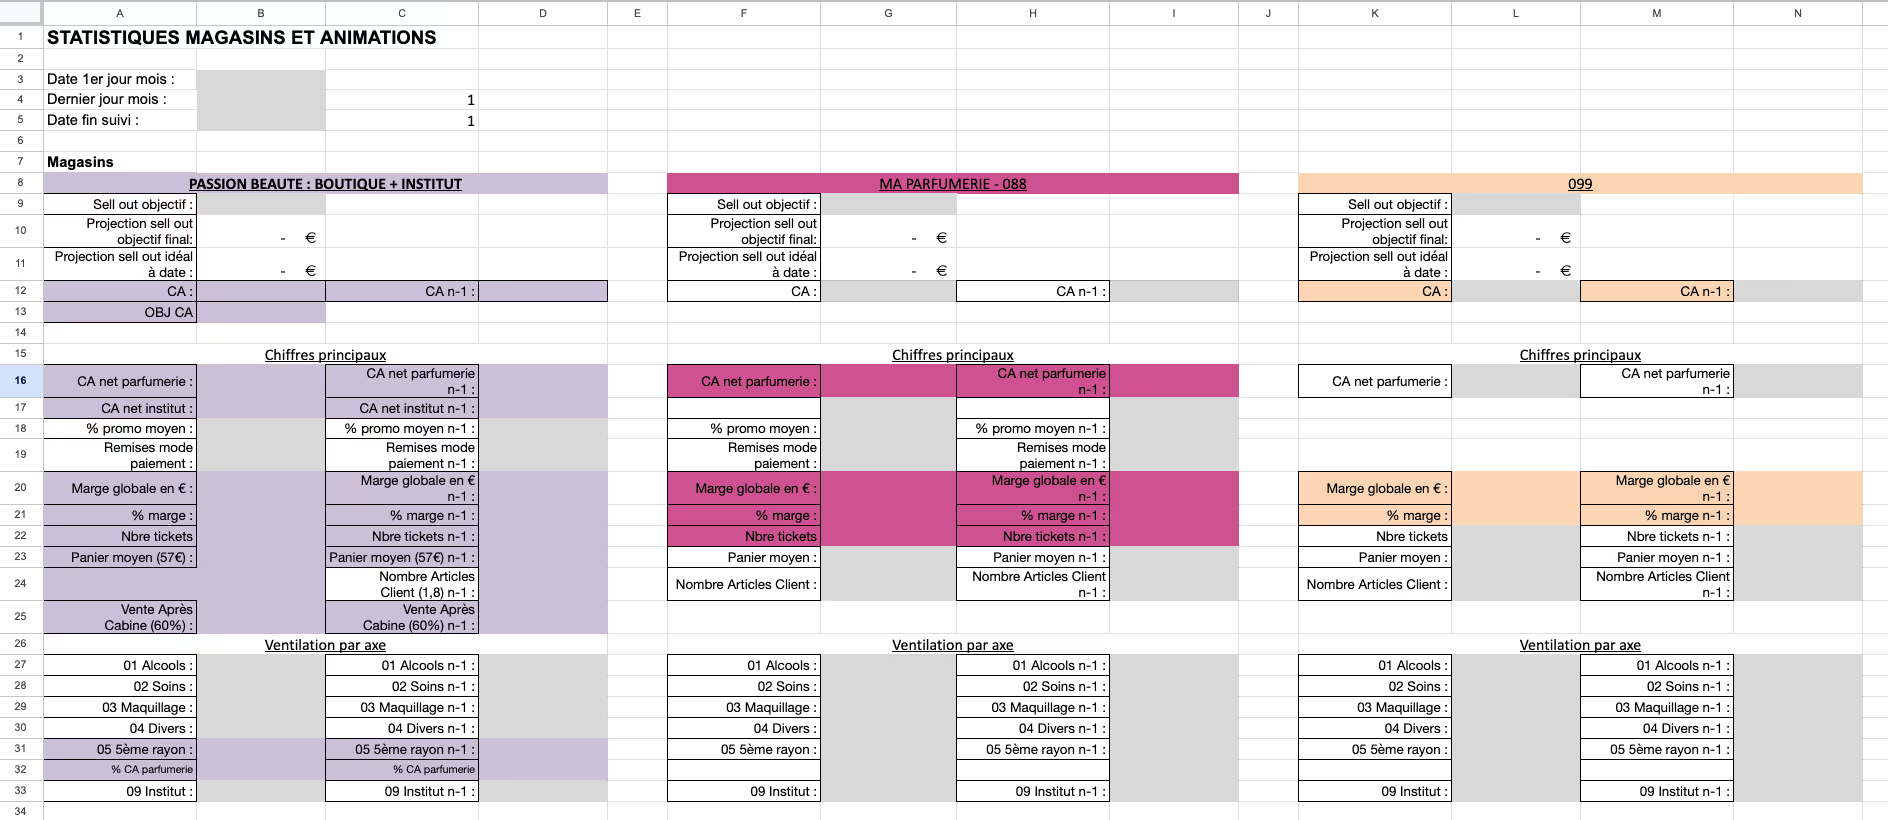
2 businesses in one workspace, with no shared naming or structure between them, means nobody trusts a view they did not build themselves. Every KPI report was rebuilt in Excel from scratch.
The workspace had grown cluttered and inconsistent across both businesses, so finding information took longer than it should have.
Reporting was manual and pulled from Excel and scattered sources every time.
Leadership had no live view of essential KPIs, and teams had no way to track operational performance as it happened.
Requests were tracked over email, which left no record of who owned what or when it was answered.
The Solution
The workspace was standardized first, because a dashboard built on an inconsistent structure reports inconsistent numbers.
Workspace cleanup. Both businesses were reorganized onto one clear, consistent structure with the clutter removed.
Automations. Recurring tasks, KPI tracking and alerting run on their own, which keeps the underlying data consistent.
Executive dashboards. 3 to 5 essential KPIs per business, each with red, orange and green status so a problem is visible without reading a number.
Operational dashboards. Team performance and operational metrics with threshold-based alerts, so a drift raises its own flag.
Centralised KPI tracking. Retail and e-commerce numbers come together in one place, pulling from sales, marketing and customer service.
A ticketing system. Email requests moved into ClickUp, where every request has an owner and a visible status.
The Results
A reorganized, standardized workspace makes information findable across both businesses. Automated dashboards cut manual reporting time by over 90 percent, roughly 5 hours a week, and the Excel rebuild is gone.
Leadership reads 3 to 5 key KPIs at a glance with color-coded alerts. Every request and issue is now tracked in ClickUp with a name attached.
Workspace structure
Reporting
Leadership visibility
Requests and accountability
ClickUp got built organically. Now nobody can find anything.
That is the same starting point as every story on this page. Tell us what is broken. You get back what a fixed version looks like, with the hours it hands you.
6 spots left this month